Resource 2. Federal R&D Funding: Quick Agency Profiles
THE FEDERAL FUNDING LANDSCAPE IS COMPLEX AND EVER-CHANGING. HERE, WE DRILL DOWN AND PROVIDE BRIEF, UP-TO-DATE PROFILES ON U.S. AGENCIES THAT AWARD MAJOR R&D GRANTS AND CONTRACTS. THIS PAGE IS NOT A SUBSTITUTE FOR DETAILED AGENCY AND CENTRALIZED WEBSITES, BUT HERE YOU WILL QUICKLY FIND KEY FACTS - BUDGET SIZE, WHERE THE MONEY GOES, TRENDS, AND PRIORITIES. WE DRAW HEAVILY FROM RECENT AAAS SCIENCE AND POLICY ANALYSES FOR THESE PROFILES.
Overview - How much does the federal government spend on R&D and where do the dollars go?
This is a confusing question as there are many categories of research and development and many ways to look at spending. Let’s work through the numbers estimated for 2013 (based on analysis by the American Association for the Advancement of Science). [Sorry, this is the last year in which I performed this detailed update, but the methodology and AAAS resources still apply if you wish to get a clearer picture for more recent fiscal years.]
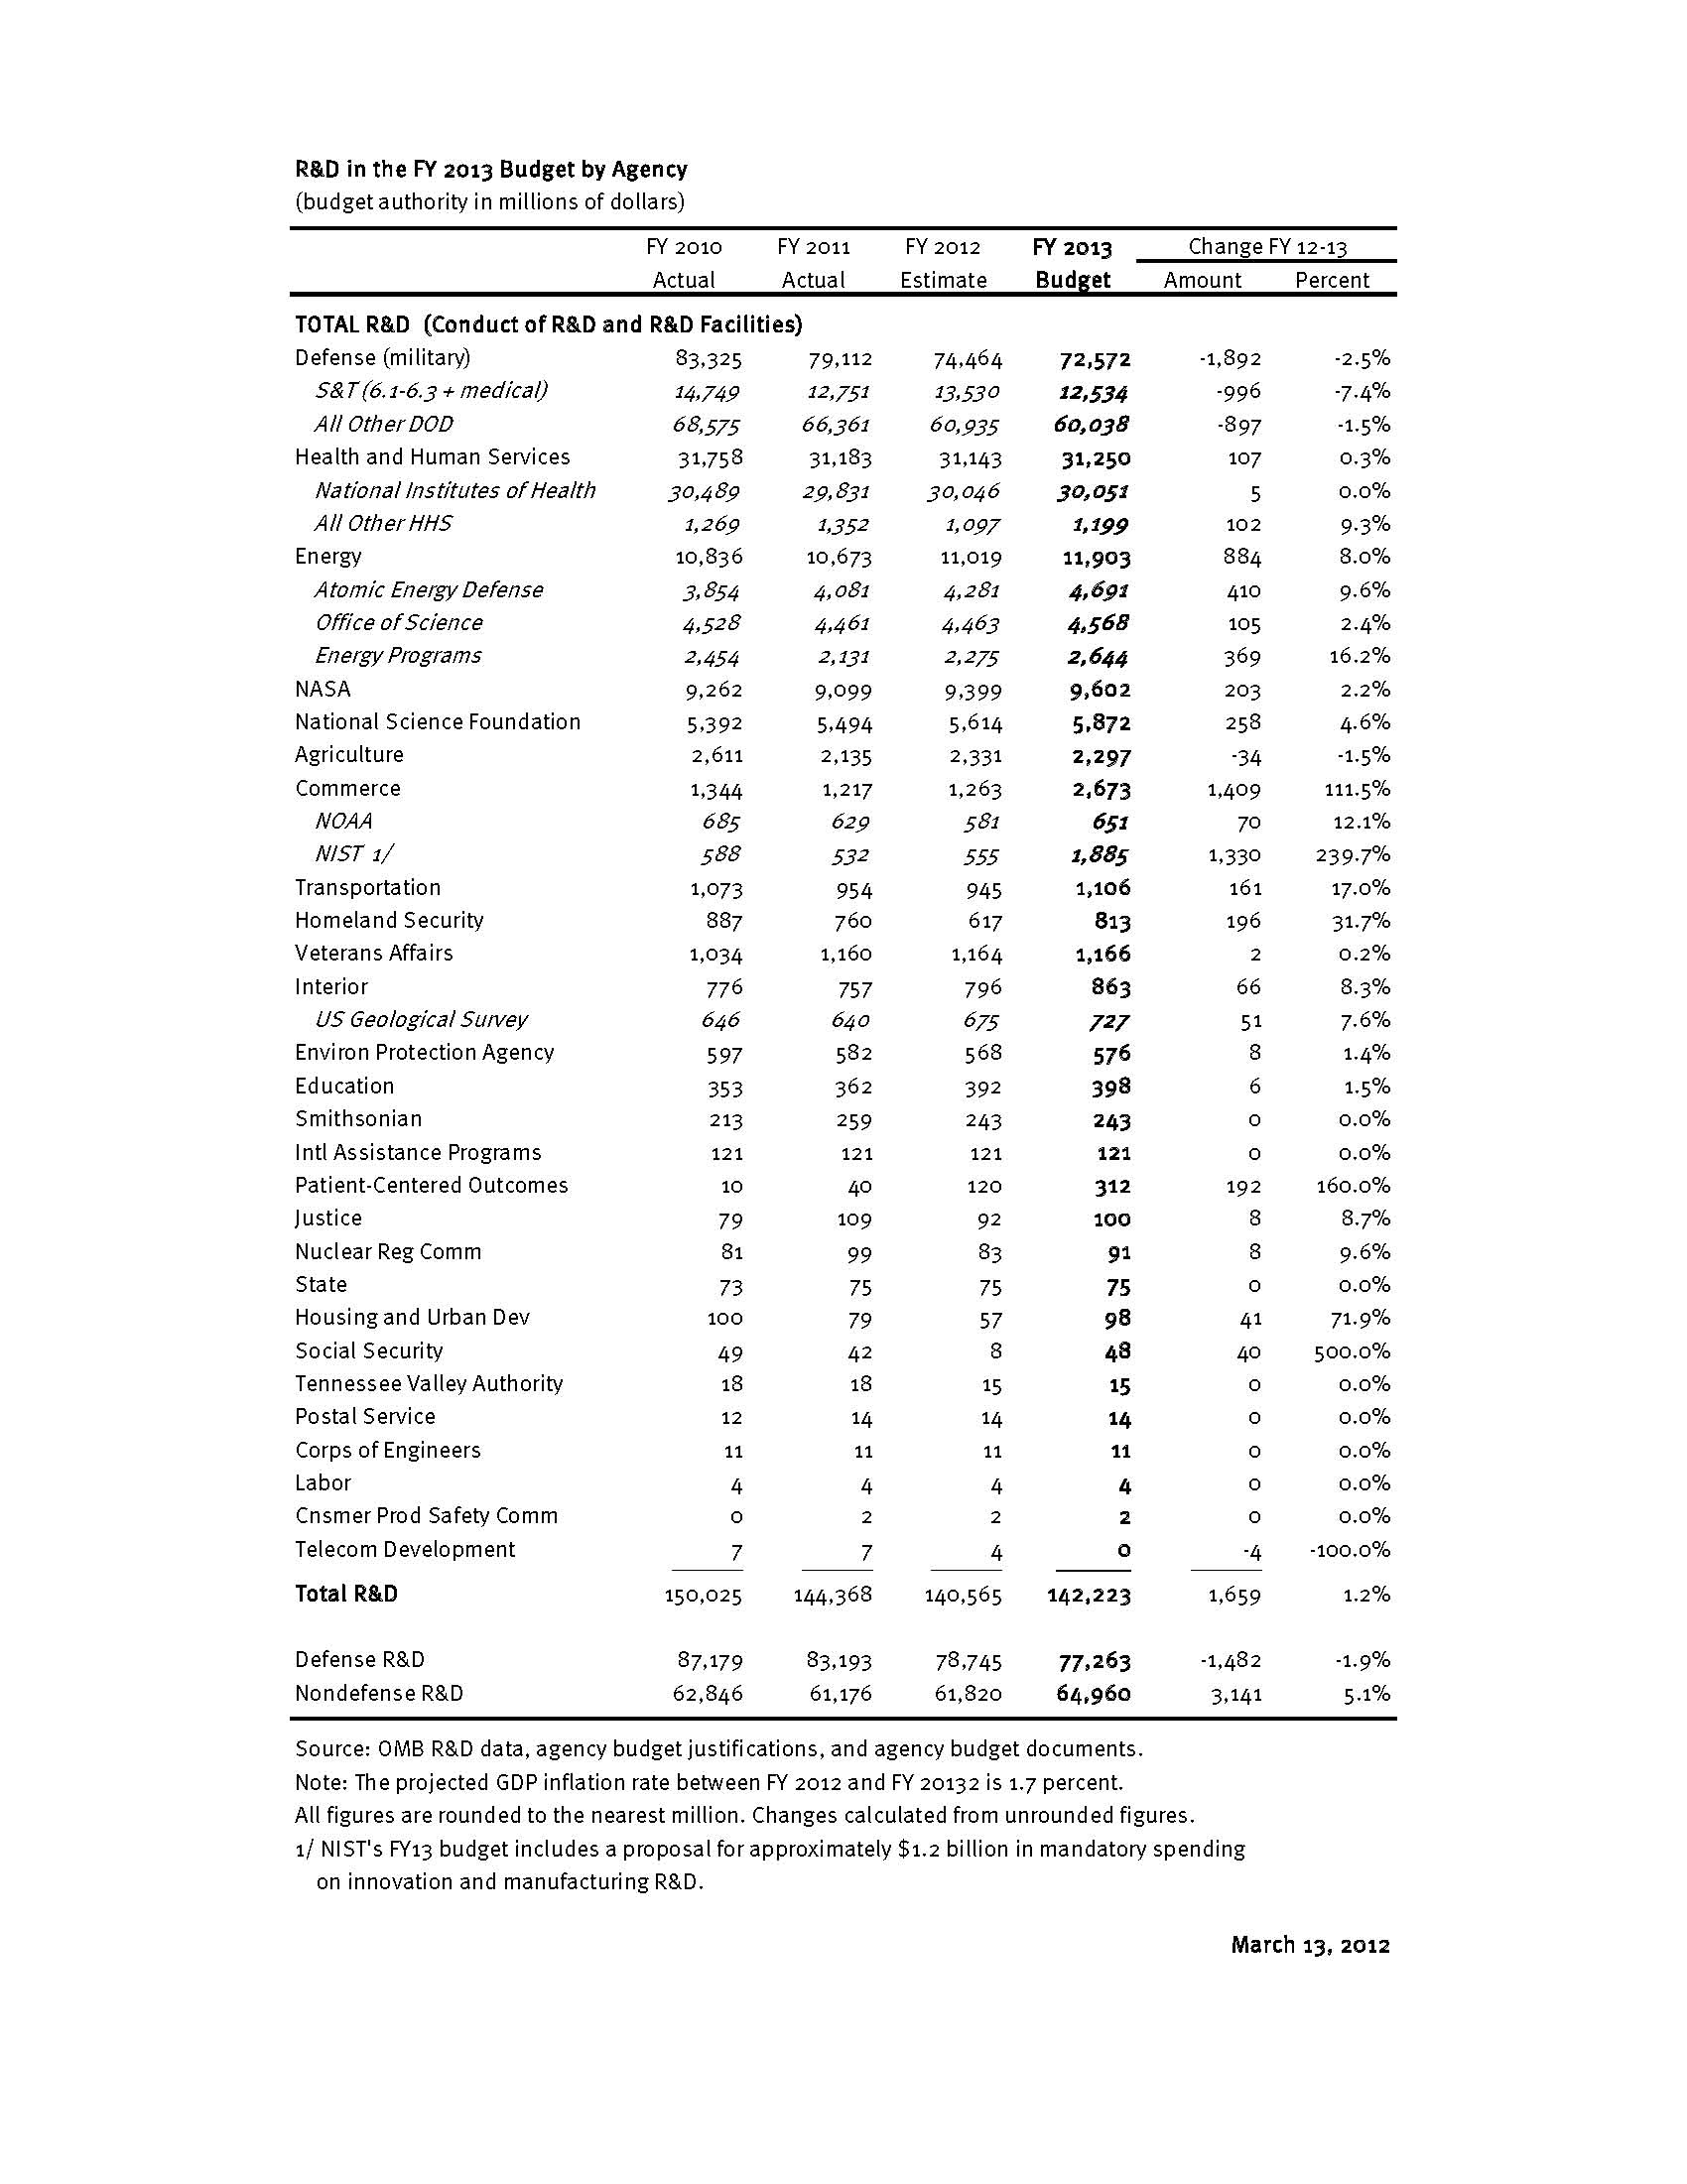
The total U.S. research and development budget for 2013 is projected at $142.2B, a 1.2% increase from 2012. $77.2B is classified as “defense” R&D; $65.0B is “non-defense” related R&D. The slight increase from 2012 (2.7%) and cuts to DOD R&D result in a net gain for non-defense R&D. This trend is also reflected in increases in “basic” and “applied” research and reduction in “development” activities (largely for weapons). As a percentage of the federal budget, total R&D spending has held constant at between 4-5% and non-defense R&D near 2% for the past 30 years. All of these numbers can be couched, of course, in terms of the country’s overall budget of approximately $3.8 trillion dollars.
As seen in the graph below, changes in the research funding landscape tend to be incremental from year to year. An exception was the period 1998-2003 when the budget of the NIH doubled. 2009 was also a singular period resulting from a one-time infusion of $18.4B of additional R&D funds via the American Recovery and Reinvestment Act, mainly to NIH, NSF, and DOE.

About 40% of federally sponsored R&D is carried out by industry, followed by 22% by universities and 6% by other non-profit institutes and hospitals. The rest (32%) is conducted by federal intramural labs (23%) and Federally Funded R&D Centers (FFRDCs – 6%) which are operated by contractors. The main question for those of you reading this website is probably, “which agencies provide external R&D grants in my areas of interest?”
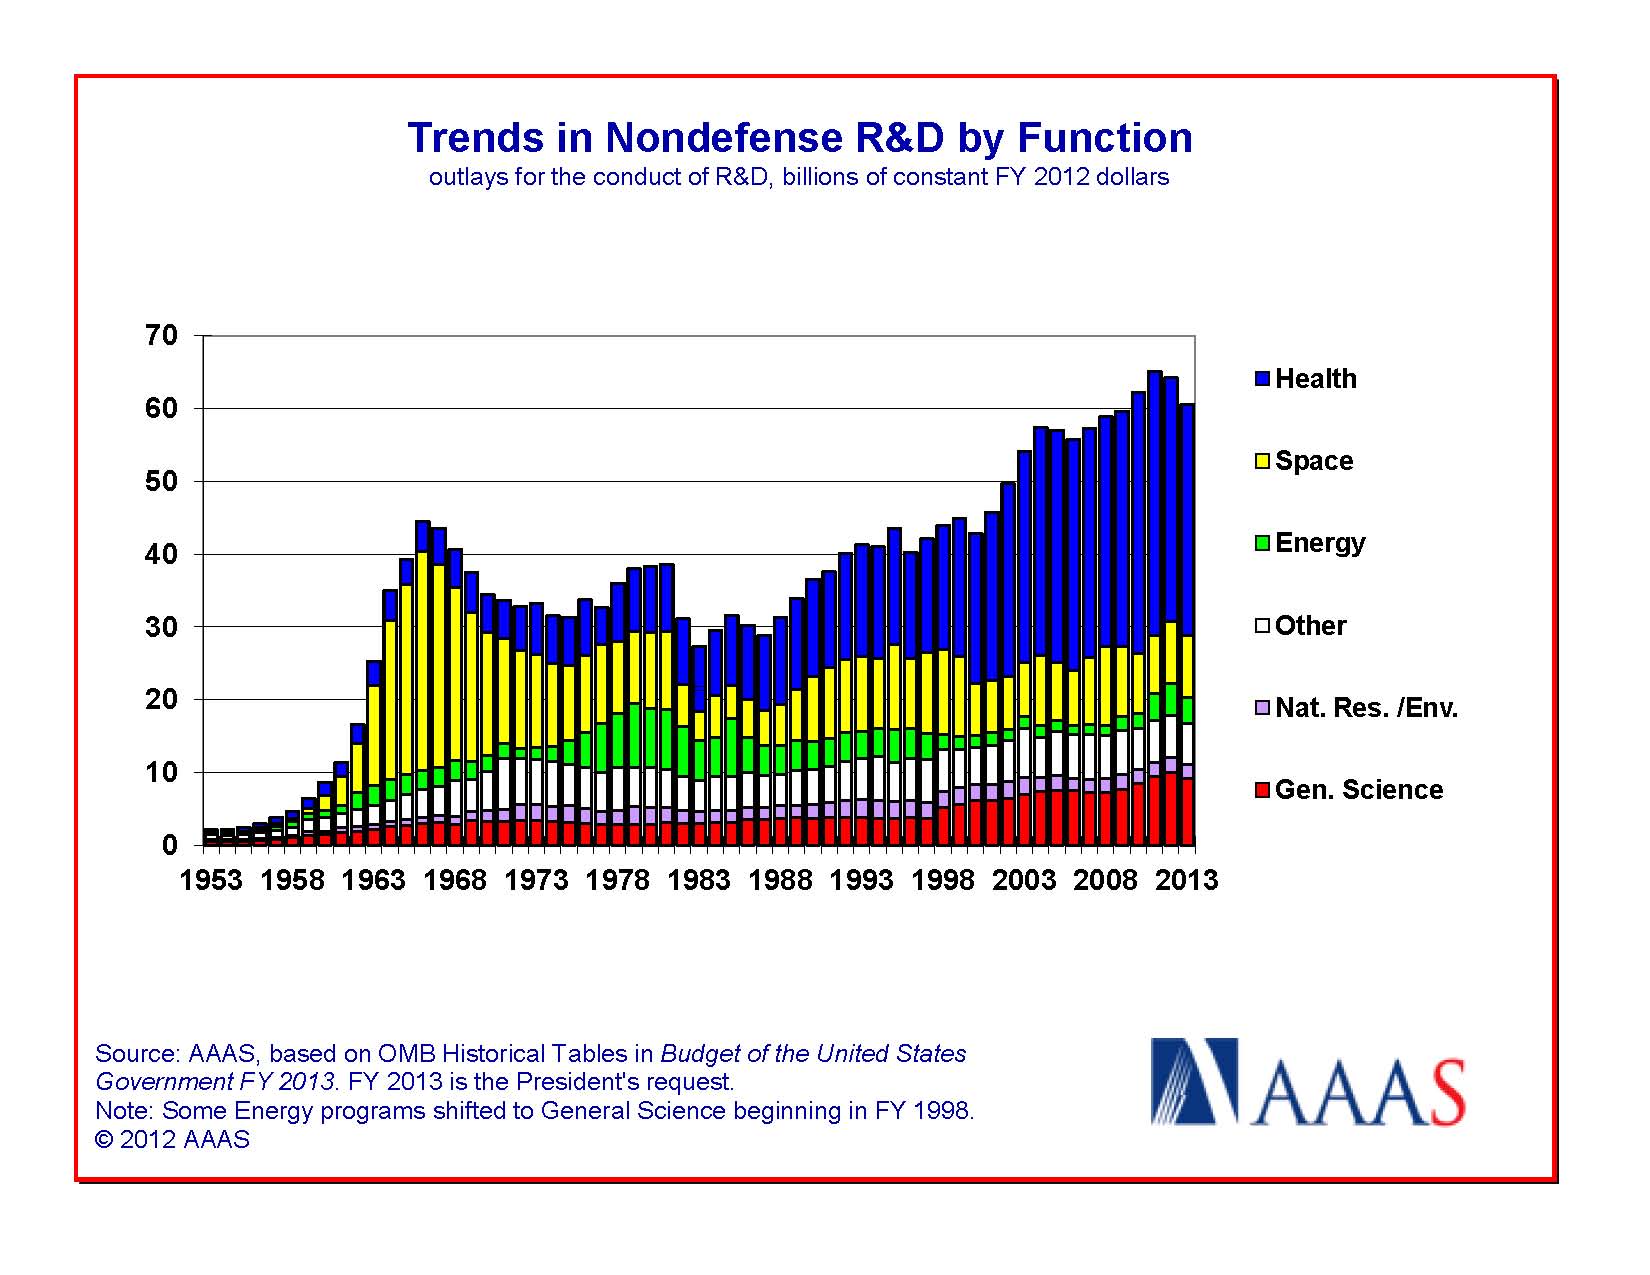
The fact is, over 20 federal departments and independent agencies have so-called R&D budgets. Of these, however, only 7 large agencies sponsor R&D as a dominant activity. The manner in which R&D funds are spent depends a great deal on the nation’s priorities and the mission, history, and political health of individual agencies. For example, in the graphic below, one can see how spending on health has skyrocketed in the past two decades and how emphasis on space and energy R&D has waxed and waned since the 1960’s.
The budget table below summarizes the nation’s forecasted spending in science across its largest agencies in 2013. Here are a couple of interesting observations:
- The total non-defense R&D expenditure budgeted for 2013, $65.0B, is about 1.7% of the total 2013 budget of $3.8T.
- Reflecting Congress’ (and the American public’s) priority on health care, the National Institutes of Health (NIH encompasses 27 institutes) receives nearly half of the total non-defense R&D budget.
Below, we attempt to provide more information of this flavor agency-by-agency via profiles we have adapted from AAAS. For a more in-depth treatment of the nation's R&D budget outlook for 2013, go to
AAAS Report XXXVII – Research and Development FY 2013.
Links to Contents Below
1. Deciphering the Department of Defense
2. NIH Profile in Funding Health Science R&D
3. What is NSF's Role in Funding Scientific Research?
4. How Will NASA Execute R&D Given its Substantial $17.7B Budget?
5. Department of Energy - Heavy Hitter in Physical Sciences and Support of National R&D Facilities
6. US Department of Agriculture
7. Department of Homeland Security - Big Money but Rough Growth Trajectory
8. Department of Commerce - R&D Explained
9. Other Agency Sponsors of R&D
1. Deciphering the Department of Defense
DOD’s overall budget exceeds $600B or nearly 1/6 of the entire national budget. The DOD’s projected 2013 R&D budget is $72.6B, a decline of about 2.5% from 2012. DOD is easily the largest sponsor of R&D in the federal system.
By far, most of the R&D budget is to support weapons development programs – around $60B. The so-called Science and Technology (S&T) portion of the budget is the difference – around $12.5B (S&T = 6.1+6.2+6.3+medical – see 4th bullet). Generally, Congress has been more supportive of a healthy DOD S&T budget than the Pentagon. There has been discussion of fixing the 6.1 portion of the S&T budget at 3% of DOD’s overall R&D budget, but this target has never yet been reached.
- Historical defense expenditures in S&T and Development are shown in Figure 1. In 2013, the Navy, Air Force, and Defense Agencies (including Missile Defense Agency, Chemical and Biological Defense Program, Defense Threat Reduction Agency, and Defense Advanced Research Projects Agency) would all decline down to $17.8, $26.7 and $19.4B, respectively (Figure 2). Only the Army would see a modest increase in its much smaller total R&D budget to $8.9B.
- DOD’s interest in scientific and engineering disciplines is comprehensive and includes medical research ($1.3B in 2012 – double DOD’s request due to Congress’ favoring of this program).
- To understand DOD’s spending priorities, one must understand its numerical lingo. DOD S&T encompasses three classes of R&D: 6.1 – Basic Research, 6.2 – Applied Research, and 6.3 - Advanced Technology Development. 6.1 and 6.2 are research categories whereas 6.3 embraces development. Other development categories include: 6.4 – Demonstration and Validation, 6.5 – Engineering and Manufacturing Development, 6.6 – RDT&E Management and Support, and 6.7 – Operational System Development. A summary table can be found in a RAND report at RAND 1194 monograph.
- The 2013 S&T budget will look like the following: 6.1 @ $2.1B, 6.2 @ $4.5B, and 6.3+medical @ $5.9B (Figure 3).
- Nearly all R&D in categories 6.4 and higher is executed by large private contractors (Lockheed Martin, Boeing, SAIC, etc.). If we exclude development activities, the 6.1+6.2 S&T pot of $6.6B funds a variety of players. Historically, about 40% of this work is done by industry, 33% by DOD labs, and 21% by universities.
- Five states receive about half of DOD’s R&D outflow, chiefly by virtue of being home to large defense contractors (CA, TX, MA, VA, MD). Virginia and Maryland benefit through proximity to the Pentagon and their housing a high density of DOD labs and federally funded R&D centers.
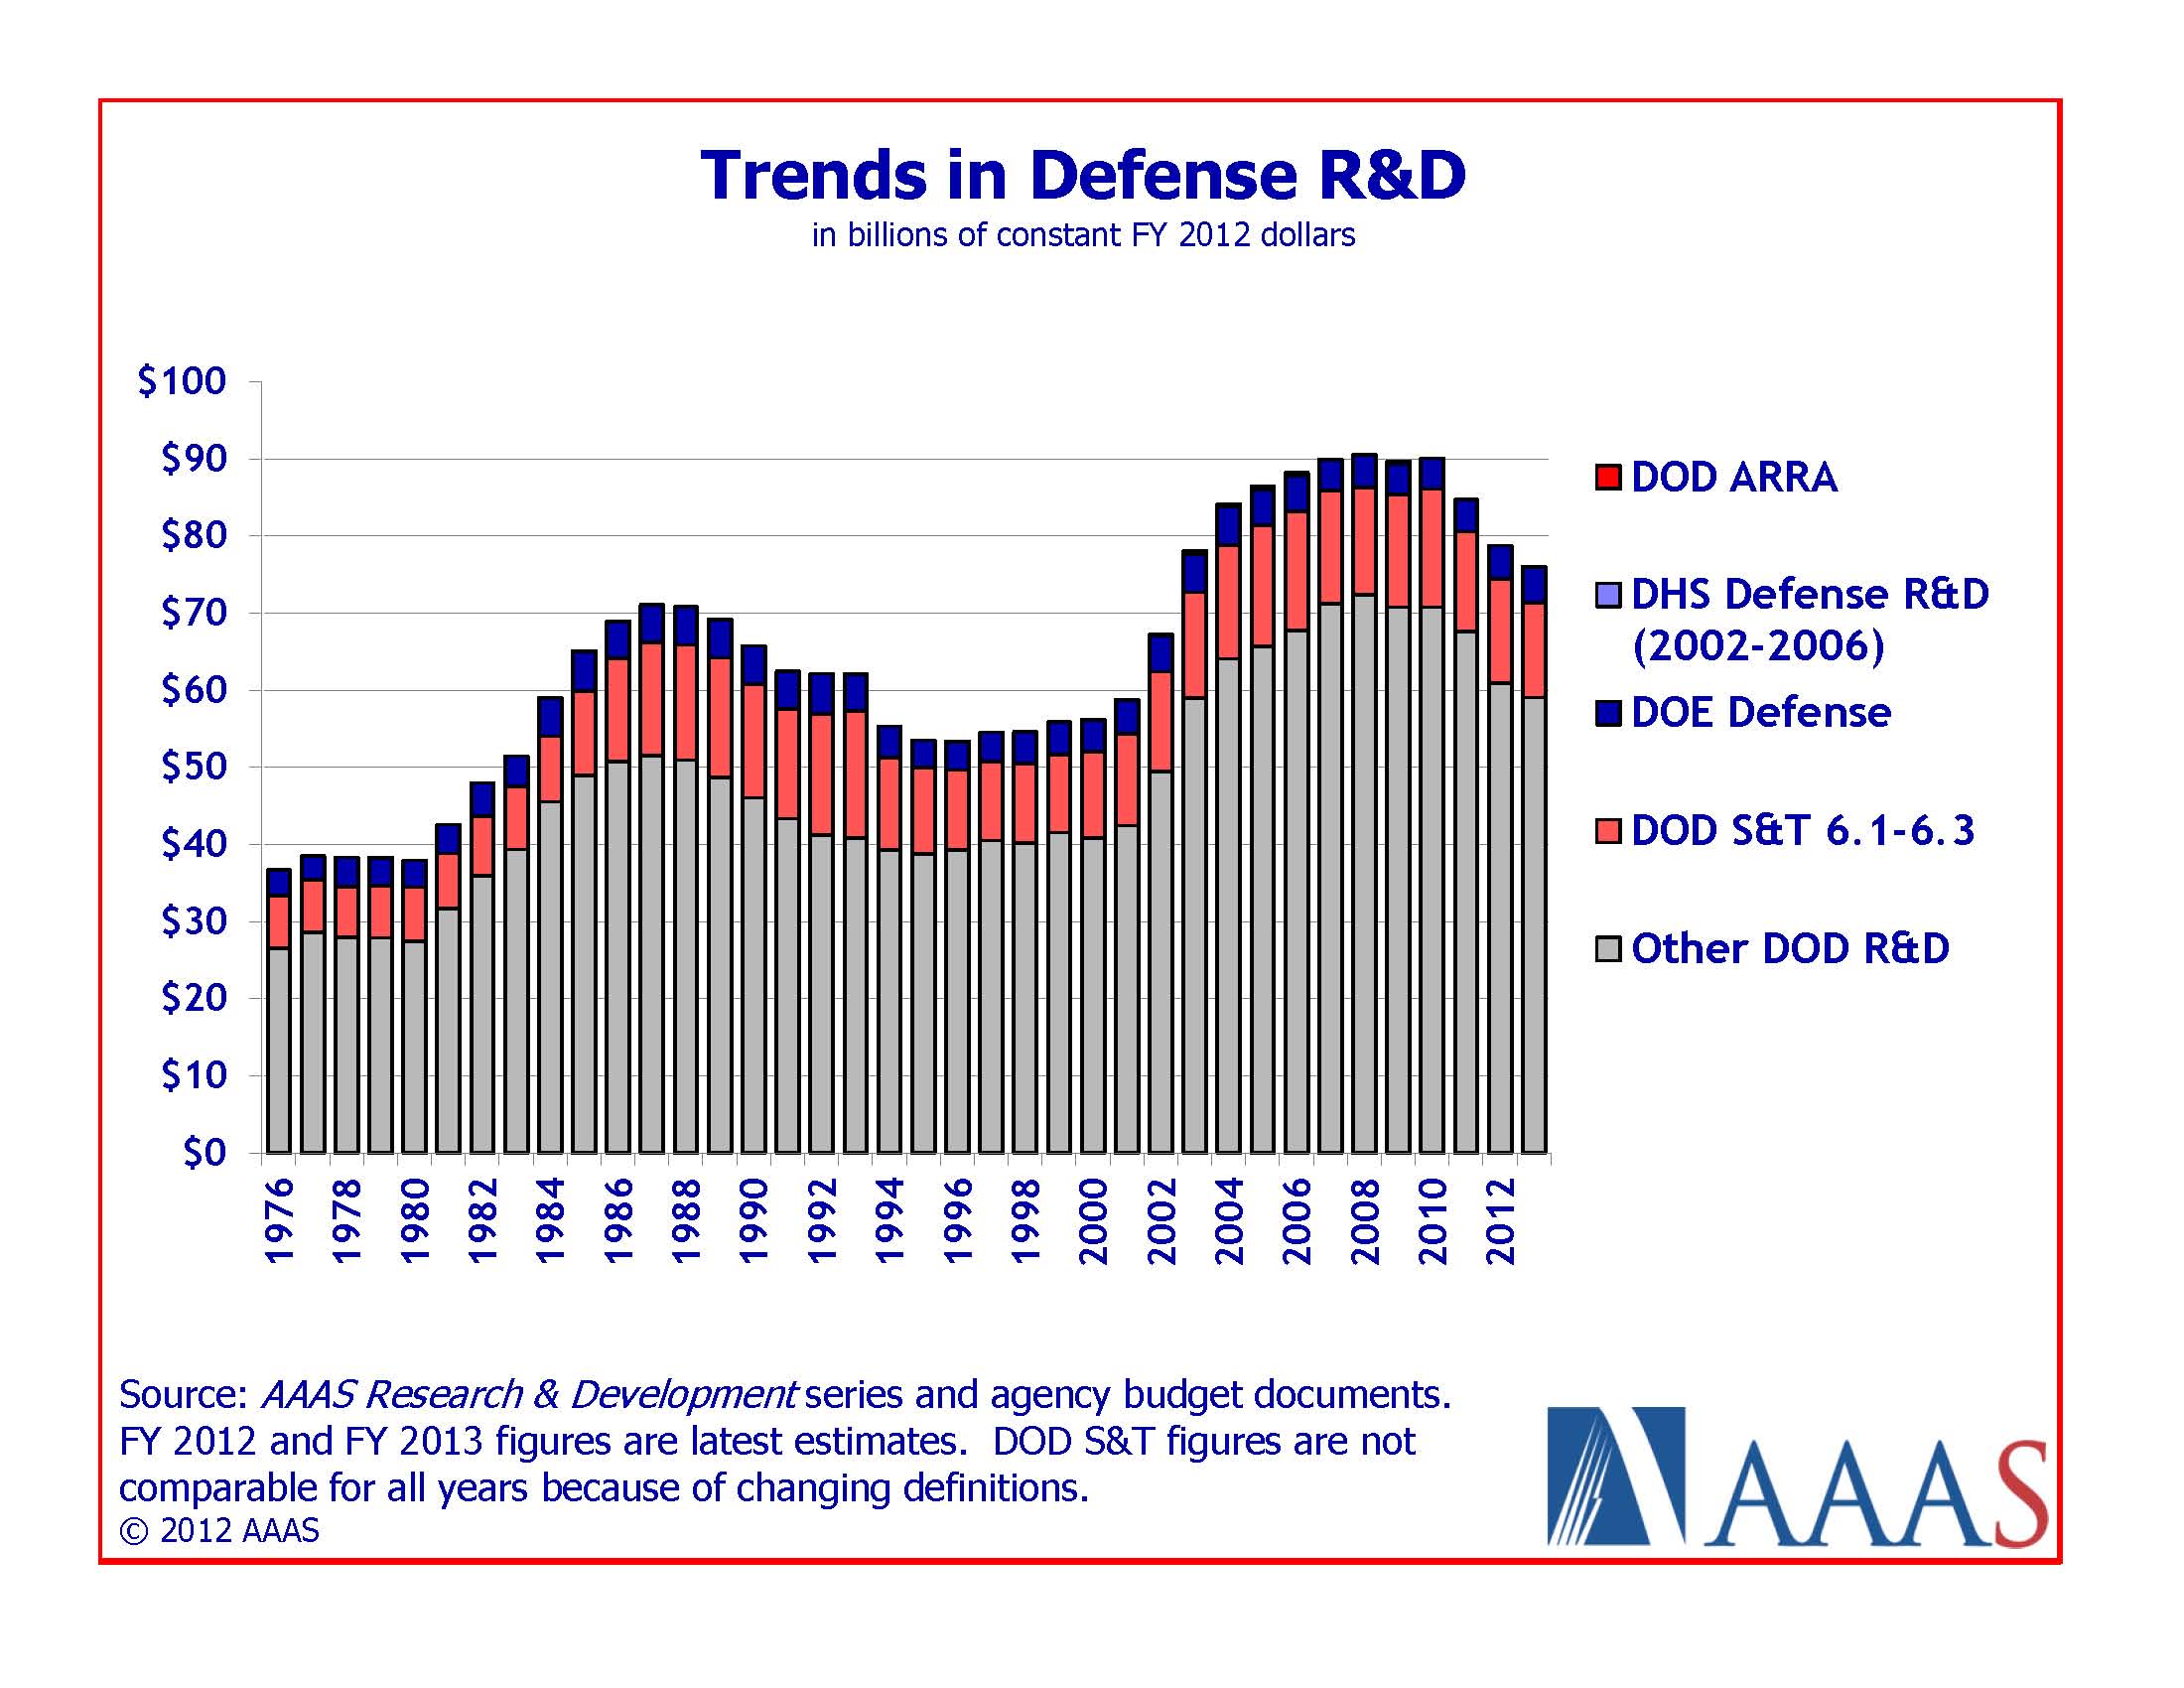
Figure 1
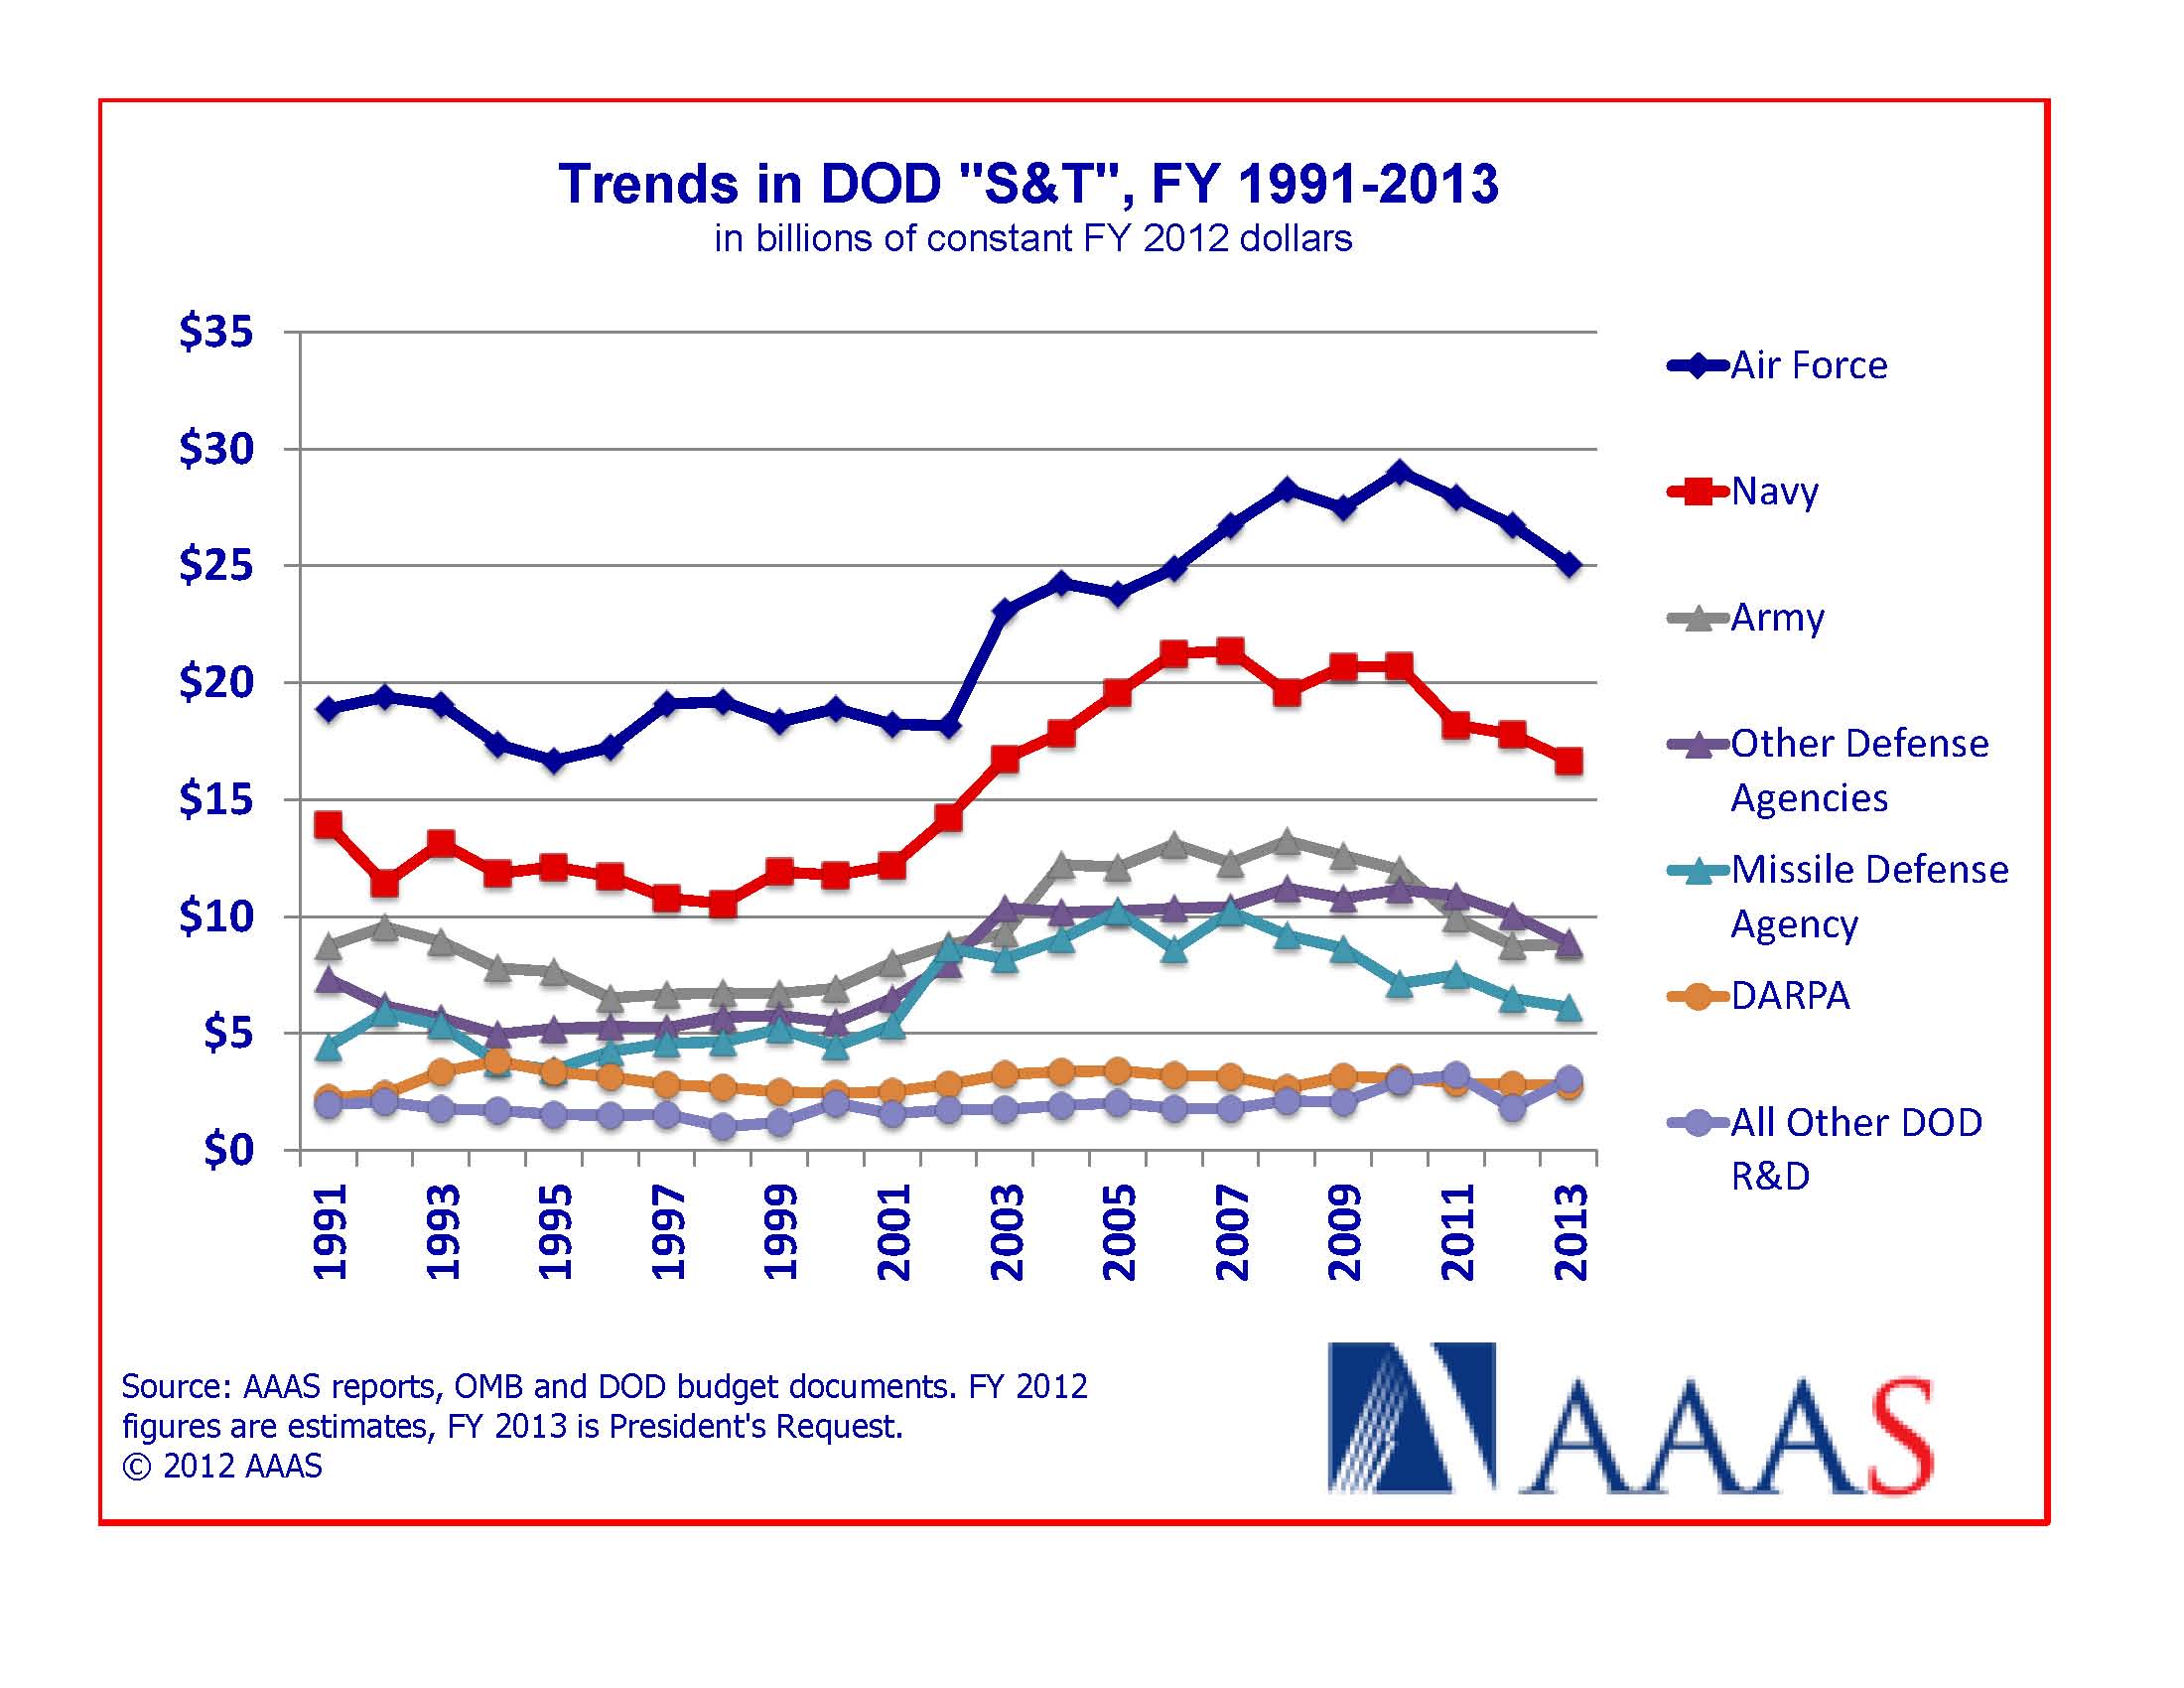
Figure 2
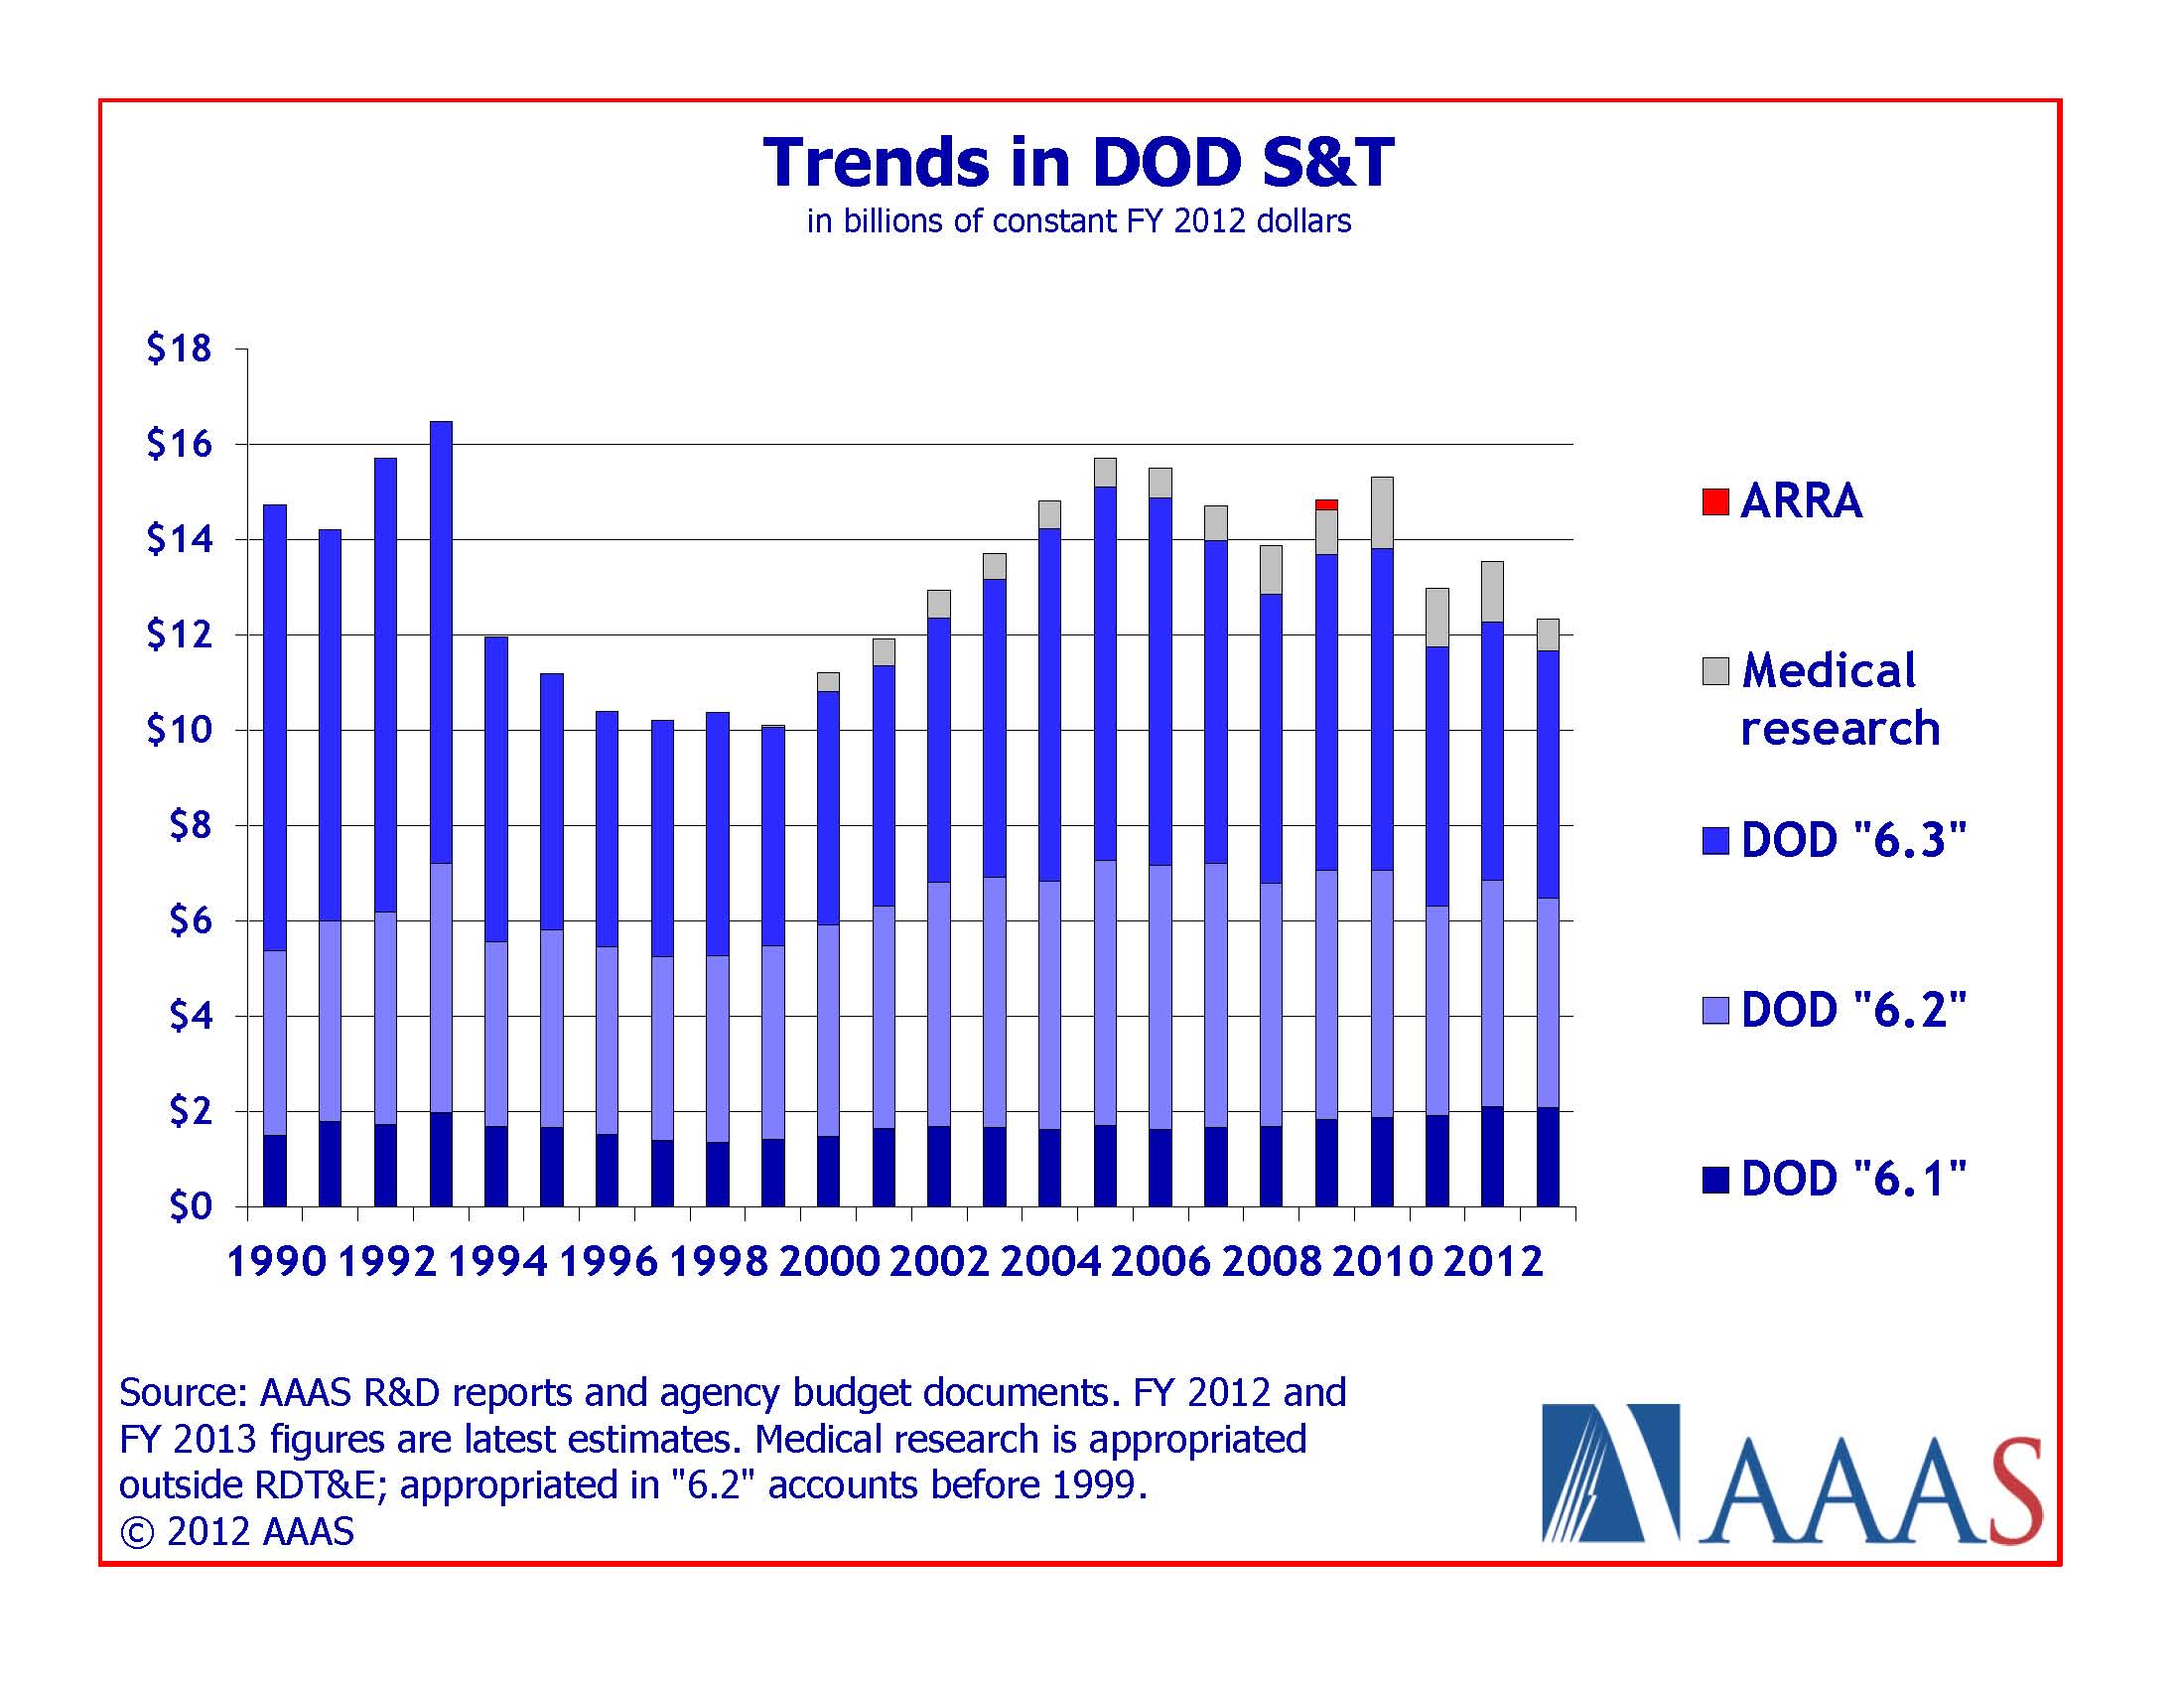
Figure 3
2. NIH Profile in Funding Health Science R&D
The National Institutes of Health comprise 27 Institutes and Centers. NIH's budget, projected at $30.9B in 2013 (unchanged from 2012), is spread out accordingly. 97% of the budget is dedicated to R&D and 3% is allocated to overhead costs and research training. Funding by general institute and funding mechanism categories is shown in Figures 1 and 2 below. The NIH is the second-largest supporter of R&D in the federal government (Department of Defense is number one) and the largest federal sponsor of R&D at colleges and universities. NIH experienced an exceptional year in 2009 when it received $10.4B from the 2009 American Recovery and Reinvestment Act but the current budget outlook appears “flat”.
- Per the agency’s Roadmap for Biomedical Research, NIH priorities in 2013 will focus on (1) investing in basic research, (2) accelerating discovery through technology, (3) advancing translational sciences, and (4) fostering new investigators and new ideas.
- The majority of NIH funds (53%) are competitively awarded to external investigators through Research Project Grants (RPGs - see figure below). NIH projects about 35,888 RPGs in 2013 worth $16.5B ($699M of which will go to SBIR/STTR) - down from 35,944 in 2012. 9415 of these will be new competing grants – an increase of 672 from 2012. The average new award size will be about $431K and project duration about 3.7 years. The average age of a first-time R01 grantee remains at 42 years old.
- About 10% of NIH’s budget is awarded through R&D contracts and another 10% to fund multidisciplinary Research Centers. Another 11% goes toward NIH’s own sizeable research laboratories, mostly in Bethesda, MD. Spending to train the next generation of biomedical researchers will total $775 million in 2013, down 0.3 percent from FY 2012.
- Success rates for new grant applications have fallen to about 20 percent in recent years from a high of 32 percent in FY 2001 (see Figure 3 for historical perspective). The success rate for 2013 is estimated at 19%, up from the all-time low of 18% in 2011. NIH will strive to maintain success rates for new and early career investigators comparable to those of the overall population.
- Among all Centers (and NIH programs for that matter), the only one to receive a substantial budget increase (11.2%) in 2013 will be the new National Center for Advancing Translational Sciences. NCATS was formed in 2012 to “translate” innovative research into useful new medical products.
- Although NIH dominates the Health and Human Services R&D portfolio, other HHS agencies (excluding NIH) will fund a still substantial $1.2B of R&D in FY 2013.
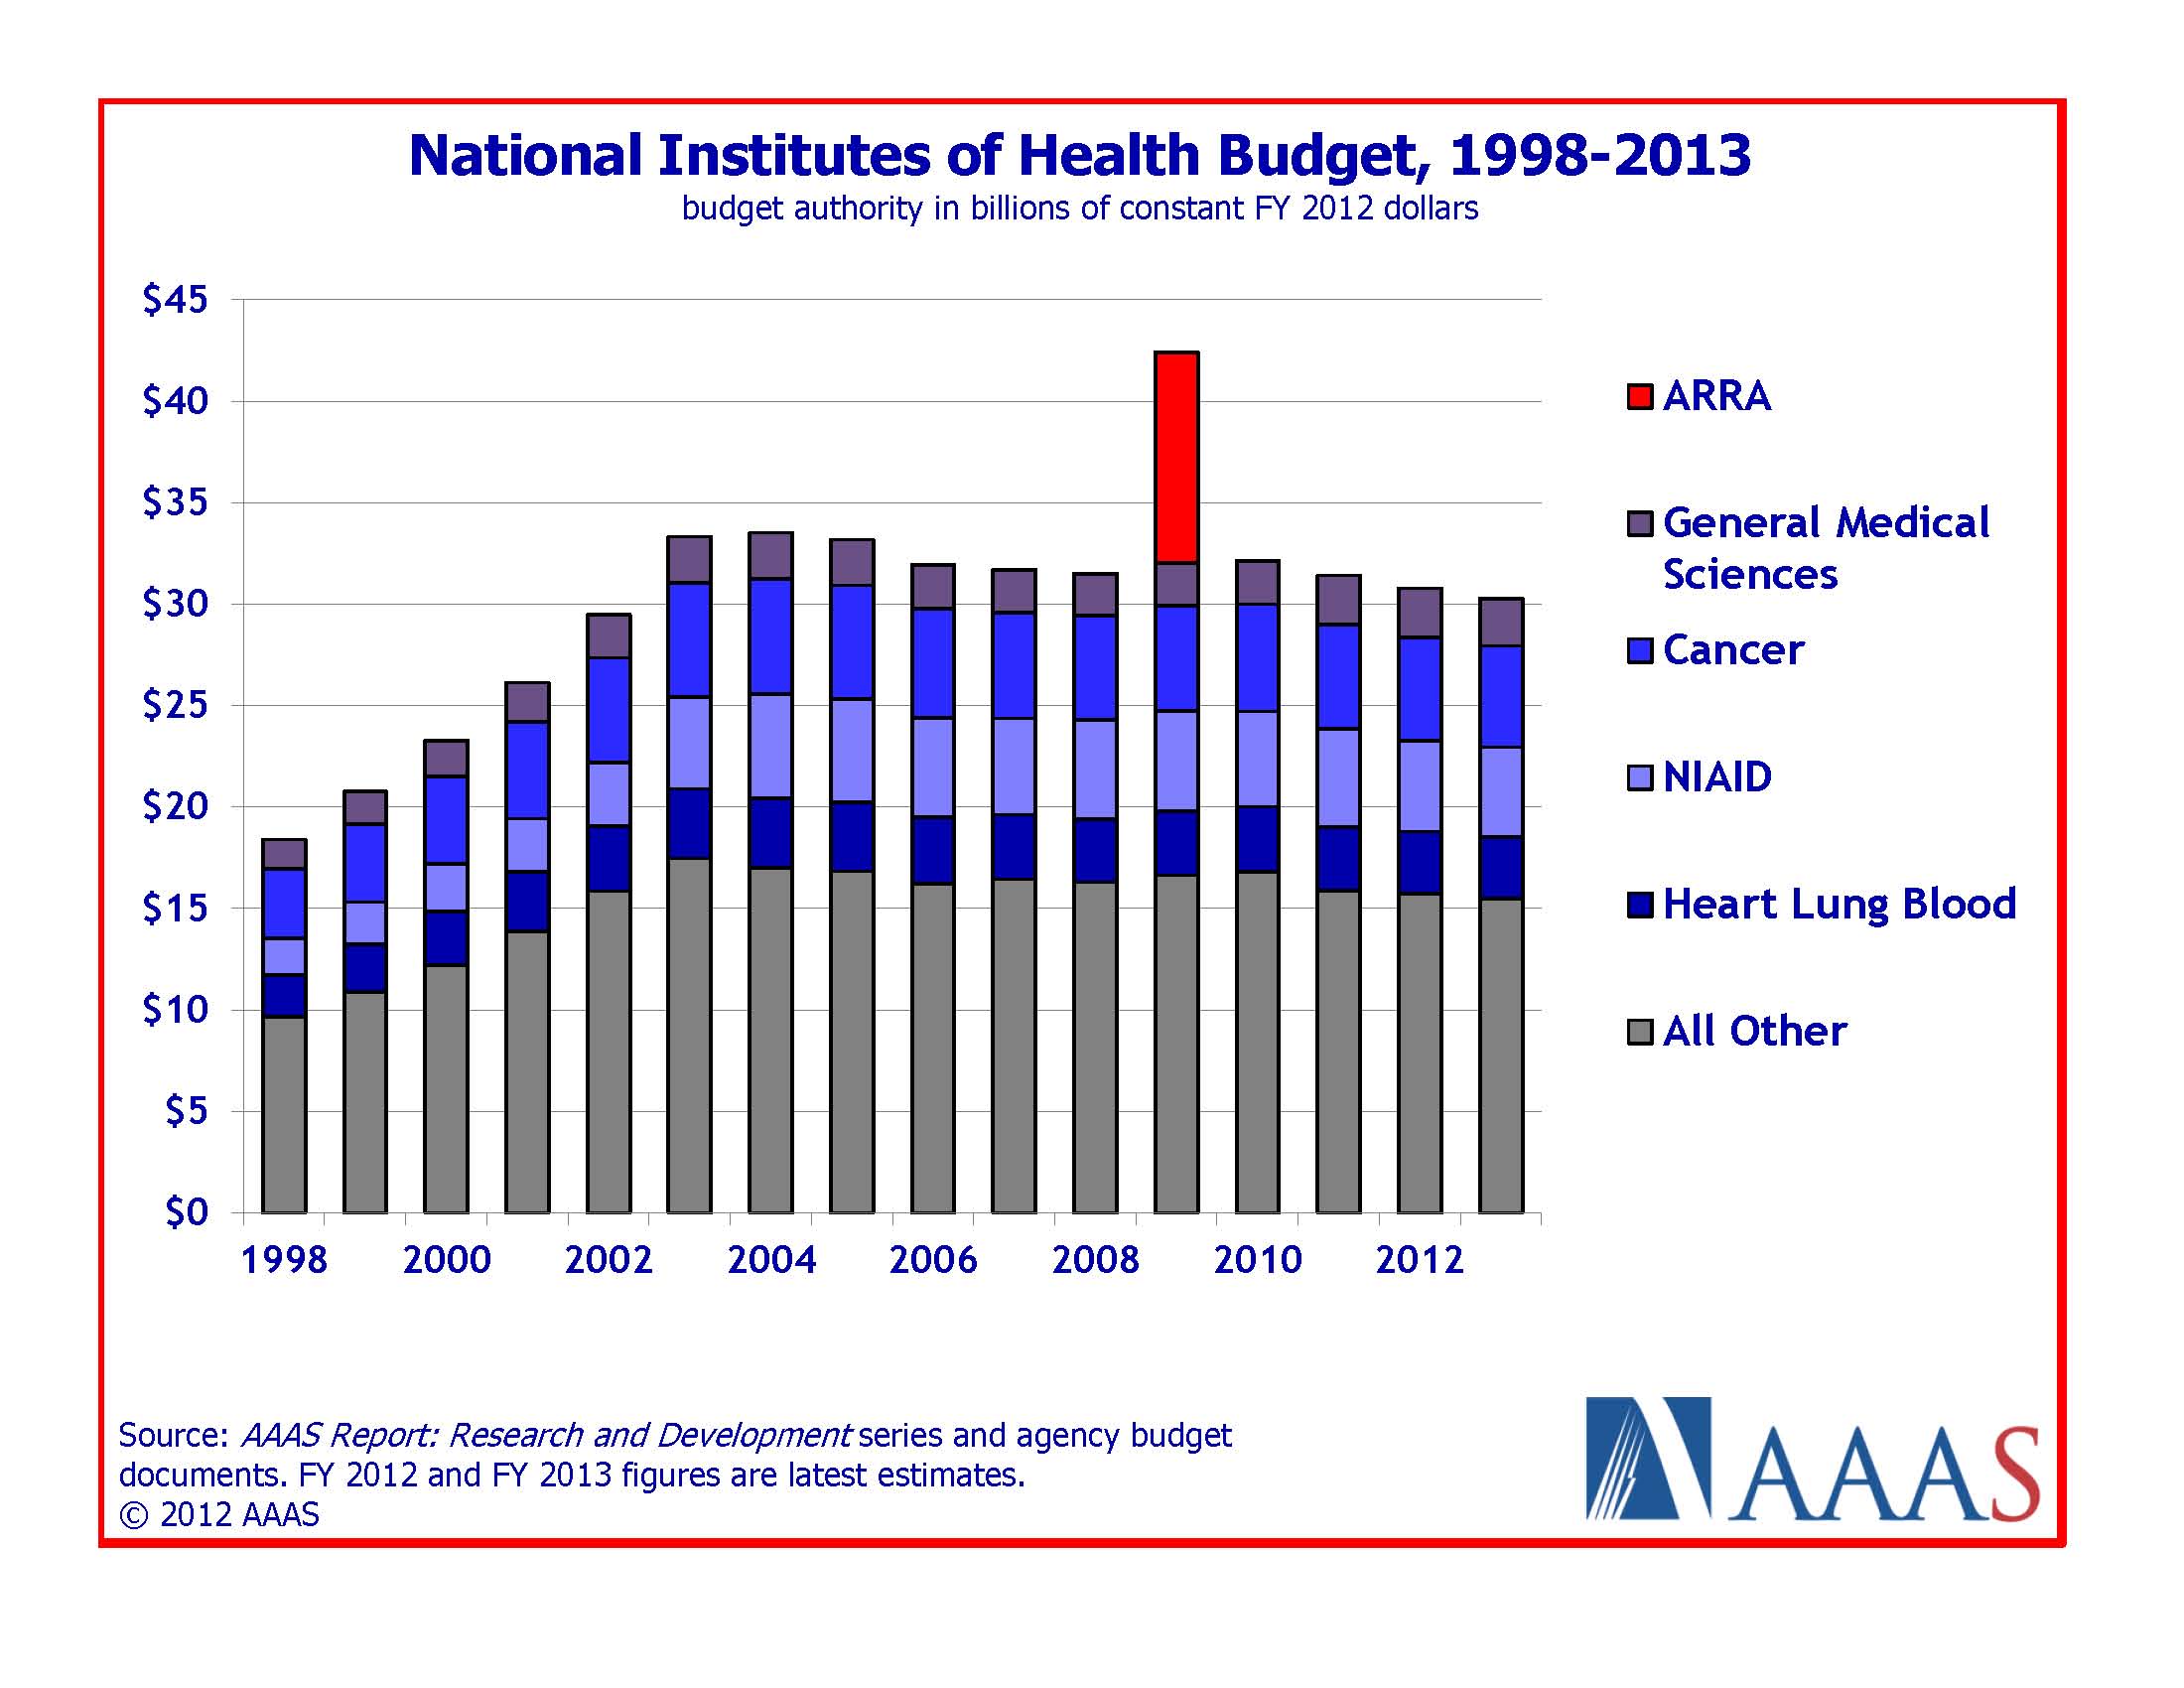
Figure 1
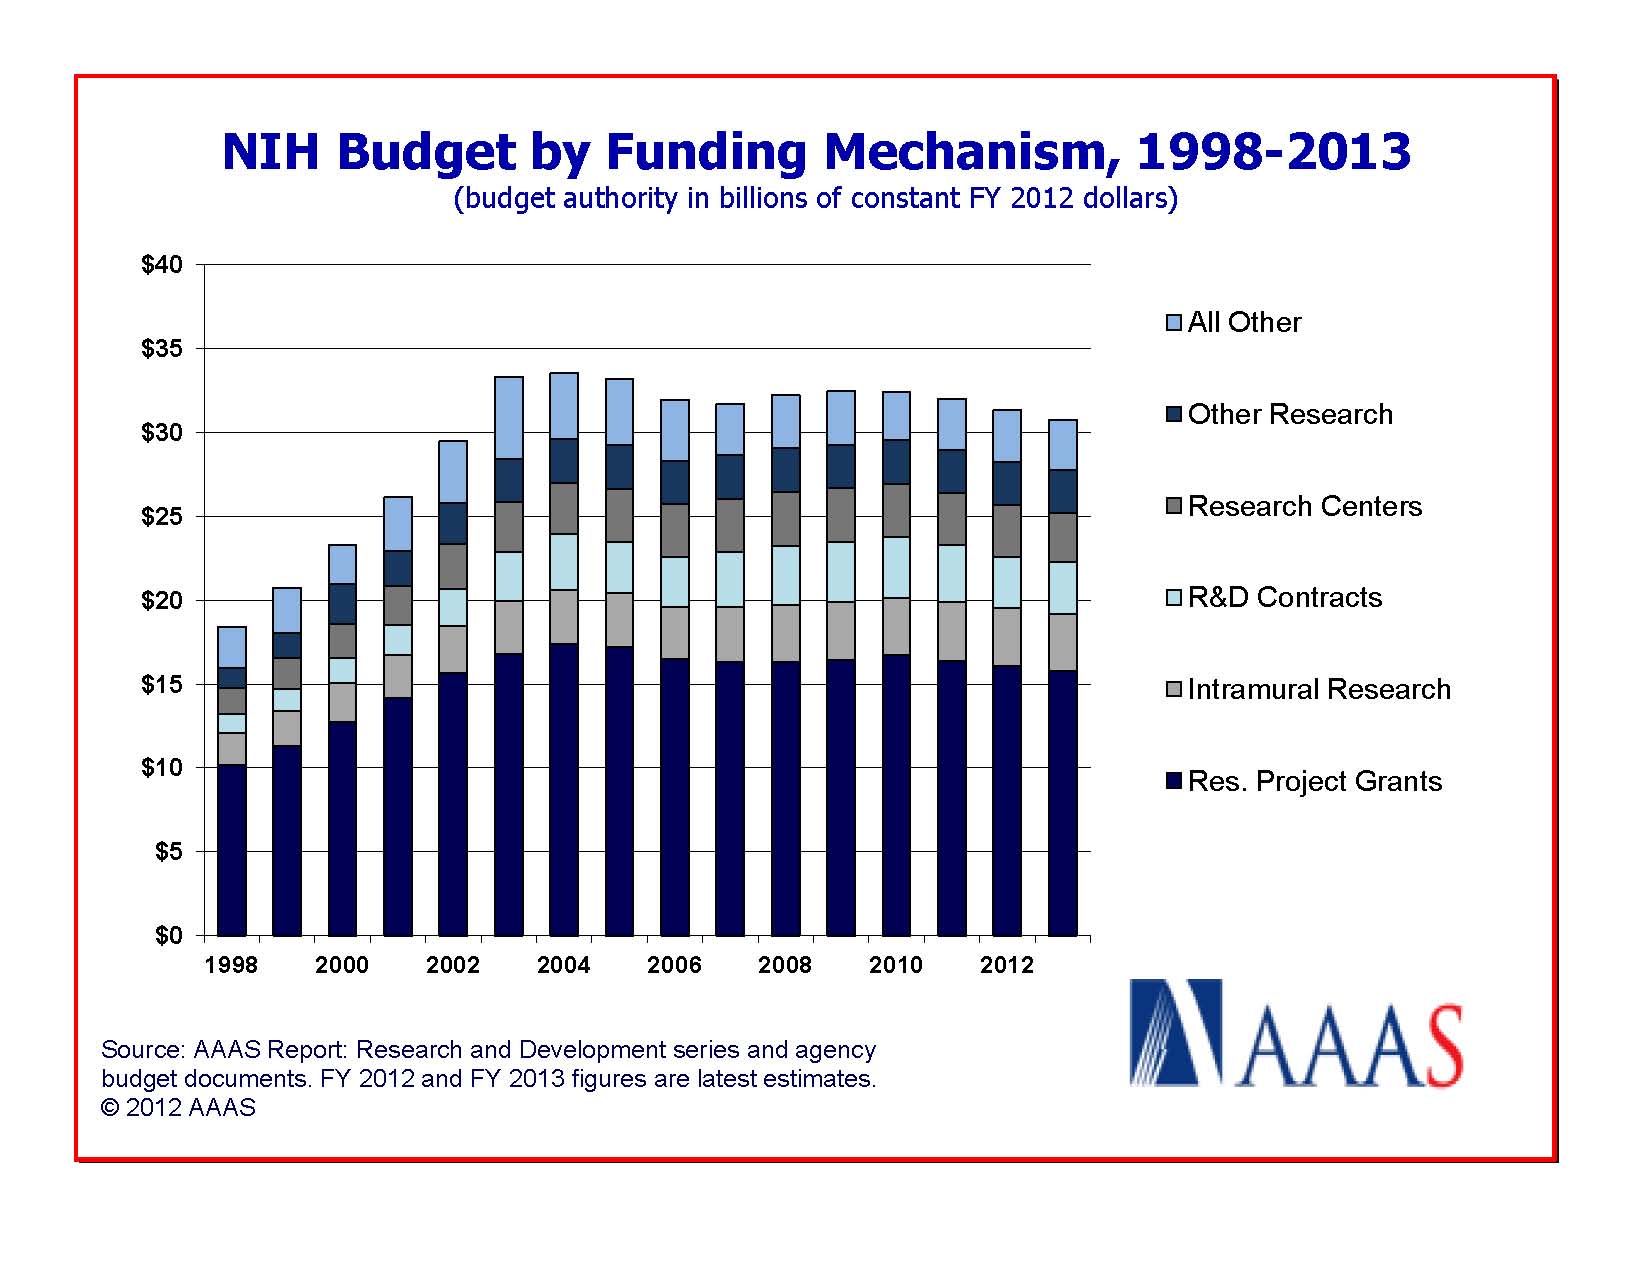
Figure 2
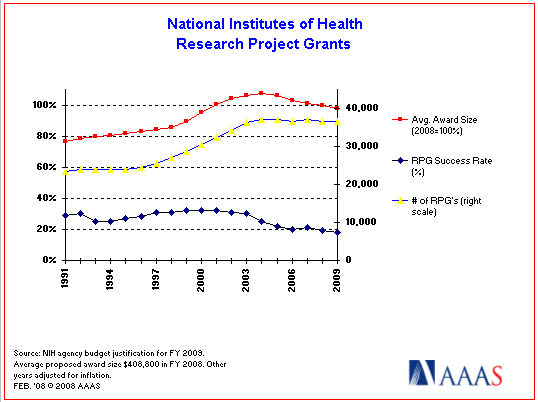
Figure 3
3. What is NSF’s Role in Funding Scientific Research?
With a proposed 2013 budget of $7.4B (4.8% above FY 2012), NSF is the only federal agency with responsibility for all science and engineering disciplines. In broad terms, the (1) physical sciences, (2) environmental sciences, (3) engineering, (4) mathematics/computer sciences, and (5) life sciences receive comparable shares of NSF funding (see Figures 1 and 2). NSF is second to NIH in support to academic R&D. NSF received $3.0B as part of the American Recovery and Reinvestment Act that was obligated by September 30, 2010.
NSF is organized into 3 directorates: (1) Research and Related Activities, (2) Education and Human Resources, and (3) Major Research Equipment and Facilities Construction. In 2013, NSF will adopt a new OneNSF Framework intended to streamline operations across organizational and disciplinary boundaries to meet the agency’s priorities in adaptive smart systems, cyber-infrastructure, STEM education research, integration of interdisciplinary effort, cybersecurity, and Science, Engineering, and Education for Sustainability (SEES).
- NSF has no laboratories of its own; 77% of its budget goes to universities and colleges – the highest proportion of any federal agency. 94% of NSF funding is awarded via a merit-based award process.
- NSF estimates that it will provide 12,000 competitive awards from a proposal pool of 55,000 in FY 2013. This represents a funding rate of 22% for competitive awards.
- The Major Research Equipment and Facilities Construction (MREFC) program would be funded at $196M to fund four major projects: Advanced LIGO; Advanced Technology Solar Telescope; Ocean Observatory Initiative; and the National Ecological Observatory Network.
- Due to their high concentration of research universities and government-owned entities such as NCAR, seven states receive over 50% of all NSF grants (CA, NY, MA, CO, IL, VA, PA – see Figure 3). To address the imbalance, NSF created the EPSCoR Program (Experimental Program to Stimulate Competitive Research) to help 25 states become more competitive.
- As one of three federal funding agencies included in America COMPETES (act passed in 2007), NSF continues to enjoy bilateral Congressional support and recognition in terms of the value NSF brings to the nation.

Figure 1
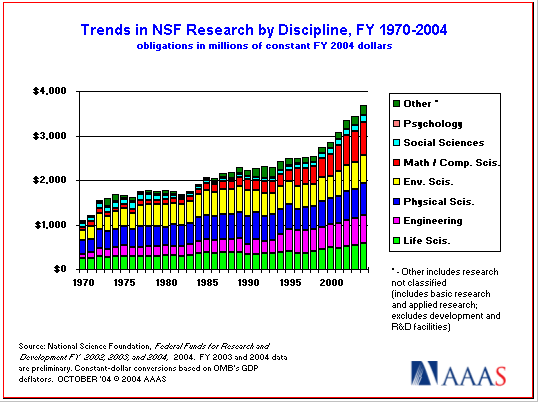
Figure 2
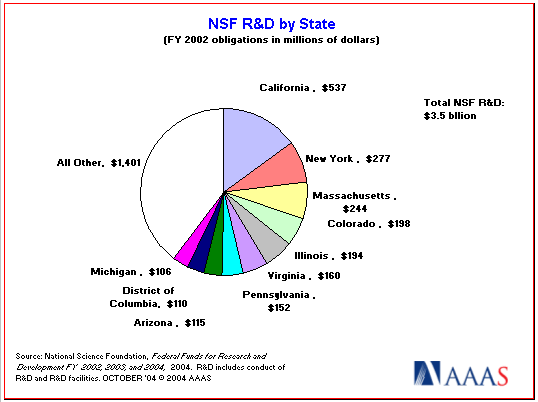
Figure 3
4. How Will NASA Execute R&D Given its Substantial $17.7B Budget?
In terms of national impact on research, the National Aeronautics and Space Administration funds around 16 percent of all federal support for engineering research and 7 percent of all federal support for basic and applied research. Historical spending by NASA in 5 major categories is shown in Figure 1. The proposed $17.7B budget for 2013, a decline of $89M from 2012, would be divided among NASA directorates as follows: $4.9B is for the Science Mission Directorate; $551M for the Aeronautics Research Mission Directorate; $3.9B for the Exploration Mission Directorate; $4.0B for the Space Operations Mission Directorate; $699M for the Space Technology Mission Directorate; $100M for the Education Mission Directorate; and $2.8B for the Cross-Agency Support Programs Mission Directorate. Notably absent are funds for the now retired Space Shuttle and the discontinued Constellation Program.
- The National Space Policy of the United States established in 2010 under the Obama Administration articulated six key goals for America’s space program: energize competitive domestic industries; expand international cooperation; strengthen stability in space; increase assurance and resilience of mission-essential functions; pursue human and robotic initiatives; and improve space-based Earth and solar observation. The National Aeronautics and Astronautics Act signed into law in October 2010 authorized increasing funding levels for NASA for the next 3 years, a Space Launch System that will operate for missions past low Earth orbit (LEO) and serve as a back-up access to the International Space Station (ISS). It also extended the ISS to 2020.
- NASA funding over the past three cycles, however, has not met authorized levels stipulated in the NASA Reauthorization Act of 2010. Combined with America’s reliance now on foreign rockets, increasing ISS costs, and uncertainty around future appropriations, NASA’s programs and direction appear in question.
- NASA research is focused on engineering (1/3 of total), environmental sciences (1/4 of total), and physical sciences. Favored engineering sub-fields include aero- and astronomical engineering. In environmental sciences, significant funds flow to oceanography and atmospheric and geological sciences. Investment in the physical sciences favors astronomy, chemistry, and physics.
- Historically, much of NASA’s budget has been for large program development with the result that industry has typically executed nearly half of NASA’s R&D (Figure 2). NASA’s own labs (including the contractor-operated Jet Propulsion Lab) execute another 33% of the NASA R&D portfolio. The amount funneled to universities placed NASA 4th in 2007 behind NIH, NSF, and DOD in sponsorship of academic research.
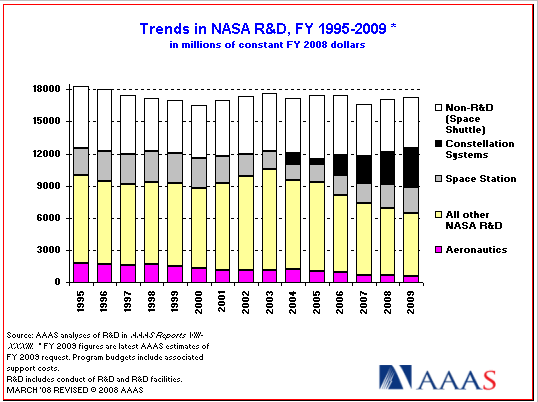
Figure 1
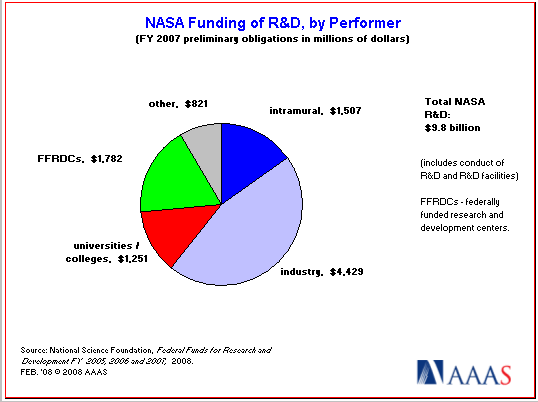
Figure 2
5. Department of Energy - Heavy Hitter in Physical Sciences and Support of National R&D Facilities
DOE is the #1 federal sponsor of the physical sciences, supplying nearly half of all federal supporting this science category. DOE alone funds nearly 2/3 of all federally-supported physics research. DOE R&D also favors computer sciences, mathematics, and engineering research in materials science and nanotechnology.
DOE’s current charter follows from its Strategic Plan goals last established in May 2011: (1) accelerate the transition to clean energy technology; (2) invest in science and innovation for national prosperity; and (3) enhance nuclear security.
DOE’s proposed $27.2B FY 2013 budget would represent a 3.2% increase relative to 2012. It would increase spending significantly for Energy programs (+15.7%), the National Nuclear Security Administration (NNSA) (+4.9%), and ARPA-E (+27.3%). The combined R&D portfolio would climb 8.0% to $11.9B. That said, however, not everyone in Congress is a supporter of DOE. Conservative Republicans, in particular, are hostile to certain programs – among these, ARPA-E and Energy Efficiency and Renewable Energy (EERE).
- DOE’s budget is divided into three categories: Science (target $4.57B in 2013), Energy ($2.64B), and Atomic Energy Defense ($4.69B). (Figure 1)
- Major Science thrusts in 2013 include Advanced Scientific Computing Research ($456M), Basic Energy Sciences ($1.8B), Biological and Environmental Research ($625.M), Fusion Energy Sciences ($398M), (FES), High-Energy Physics ($77M), and Nuclear Physics ($527M). The proposed budget would also continue to fully fund all 46 Energy Frontier Research Centers and 2 Energy Hubs managed by BES. (Historical spending by Office of Science shown in Fig 2).
- In Energy, key R&D areas under EERE will include Biomass and Biorefinery Systems, Building Technologies, Geothermal Technology, Solar Energy,Vehicle Technologies, Wind Energy, Advanced Manufacturing and Hydrogen and Fuel Cell Technologies. Outside of EERE, additional R&D funds will be spent on Electricity Delivery and Reliability (Clean Energy Transmission and Reliability, Smart Grid, Energy Storage technologies, and Cyber Security for Energy Delivery Systems), Nuclear Power (Reactor Concepts and nuclear fuel cycle R&D), and Fossil Energy R&D (Coal including Carbon Capture / Carbon Storage, and Natural Gas).
- Atomic Defense R&D spending is mainly in the areas of the National Nuclear Security Administration’s Weapons Activities, Naval Reactors, and Defense Nuclear Nonproliferation.
- DOE’s dominance in the physical sciences may not be appreciated by all because roughly half of its Science R&D funding goes to operate and construct facilities at federal laboratories that are contractor-operated (e.g. ORNL, BNL, ANL), while the other half supports research, also mostly at DOE laboratories. In 2004, 18% of DOE’s $3.5B Office of Science budget, or $626M, went to universities and colleges.
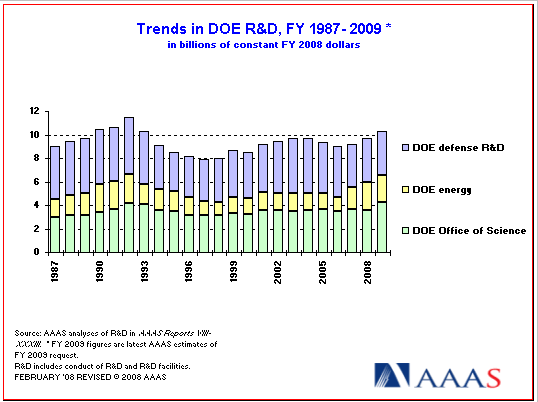
Figure 1
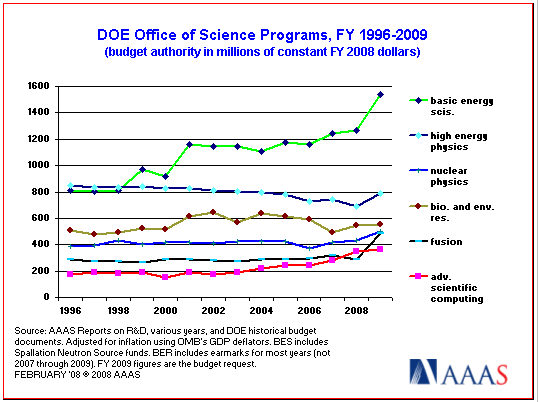
Figure 2
6. US Department of Agriculture
With a proposed 2013 R&D budget of $2.297B, the USDA is the 6th largest sponsor of research and development in the federal government. USDA supports over 90% of the total federal outlay for agricultural sciences. Other notable areas of emphasis include environmental biology and economics (the latter through the ERS – Economic Research Service).
- USDA’s main service entities are: the Agricultural Research Service (ARS), National Institute of Food and Agriculture (NIFA – formerly the Cooperative State Research, Education, and Extension Service or CSREES), Economic Research Service (ERS), the National Agricultural Statistics Service (NASS), and the Forest Service (see Figure 1 for funding history of these agencies).
- Nearly all R&D conducted by ARS, the Economic Research Service (ERS), and the Forest Service is intramural – that it, it is performed by USDA staff at USDA facilities. This combined expenditure accounts for over 2/3 of the R&D budget.
- Extramural R&D is administered mainly by NIFA through appropriation to land-grant universities and the American Food Research Institute (AFRI) - the principal competitive grants program of USDA ($325M in 2013 – up from $264M in 2012) (see Figure 2 for historical breakout of grant recipients). Though $325M falls short of the intended $500M annual funding rate when AFRI was conceived, steady increases over the past 4 years from the base amount of $209M allocated in 2009 are encouraging.
- USDA’s R&D priorities in 2013 include the following broad thrust areas: (1) New products/product quality/value added; (2) Livestock production; (3) Food safety; (4) Livestock protection; (5) Crop protection; (6) Human nutrition; and (7) Environmental stewardship.
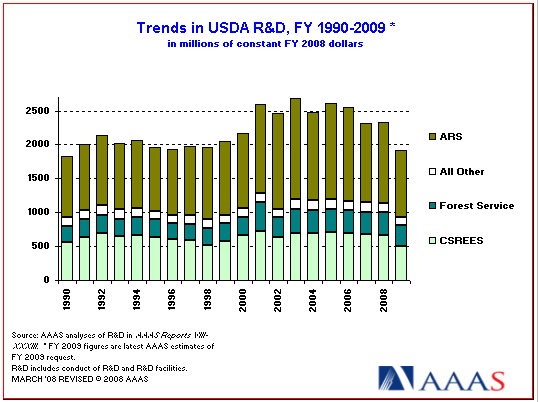
Figure 1
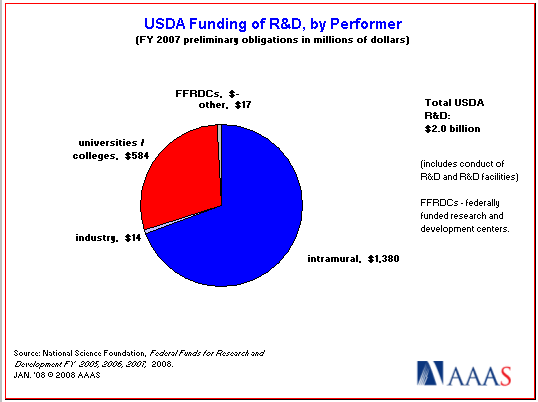
Figure 2
7. Department of Homeland Security - Big Money but Rough Growth Trajectory
Formed in response to the terrorist strike in the US in 2001, DHS has become the government’s 7th largest R&D funding agency. The overall budget proposed for DHS in 2013 is a very substantial $39.5B, but only $813M is designated for R&D. $813M would represent a 32% increase over funds received in FY2012 – a year in which Congress appropriated only $533M to DHS for this purpose (48% of the Department’s R&D budget request).
As a relatively new entity, DHS has seen its R&D budget grow rapidly to a peak in 2006, followed by a precipitous decrease (Figure 1 shows R&D funding through 2009). Cutbacks reflect dissatisfaction on the part of Congress over the agency’s ability to set priorities, manage finances, collaborate with other agencies, evaluate its performance, and respond to Congress. As a result, Under Secretary O’Toole began extensive restructuring of the S&T Directorate in 2011.
- S&T has a wide-ranging mission that includes basic and applied research as well as testing and evaluation of new technologies before they are implementated in the field. Like the DOD, DHS funds R&D across a very broad swath of technical disciplines, with particular emphasis on life sciences and engineering to address biological countermeasures.
- The Research, Development, and Innovation (RD&I) Program/Project Activities (PPA) will be the major sponsor of DHS R&D ($478M) in 2013, Within RD&I, work is funded in six thrusts: Apex Research and Development; Border Security Research and Development; Chemical, Biological, and Explosive Defense Research and Development; Counter Terrorism; Disaster Resilience; and Cyber Security.
- Another PPA administered by the Office of University Programs will support $40M of homeland security-related research and education at U.S. colleges and universities. Activities will be carried out through three program areas: the DHS S&T University Centers of Excellence (COEs); Educational programs; and the Minority Serving Institutions program.
- The Transformational and Applied Research (TAR) programs within the Domestic Nuclear Detection Office (DNDO) will also support significant basic and applied research ($84M) via three projects: the Exploratory Research Program, (ERP); the Advanced Technology Demonstration (ATD); and the Academic Research Initiative (ARI).